R is used to parse the JMH benchmark data and plot these graphs.
Types of Error bars used to plot the diagram
| Error bars | Type | Description |
| Standard error (SEM) | Inferential | A measure of how variable the mean will be, if you repeat the whole study many times. |
| Confidence interval (CI) | Inferential | A range of values one can be 99% confident contains the true mean. |
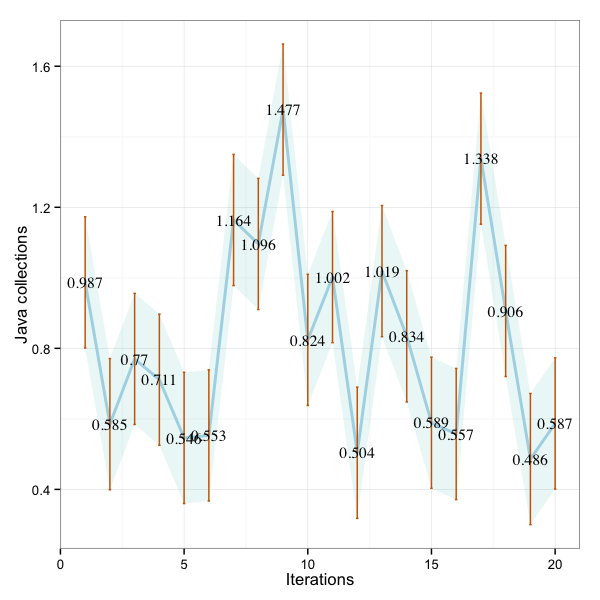
Java Collections
R summary
| Min. | 1st Qu. | Median | Mean | 3rd Qu. | Max. |
| 0.2720 | 0.3558 | 0.5040 | 0.4950 | 0.5742 | 0.8150 |
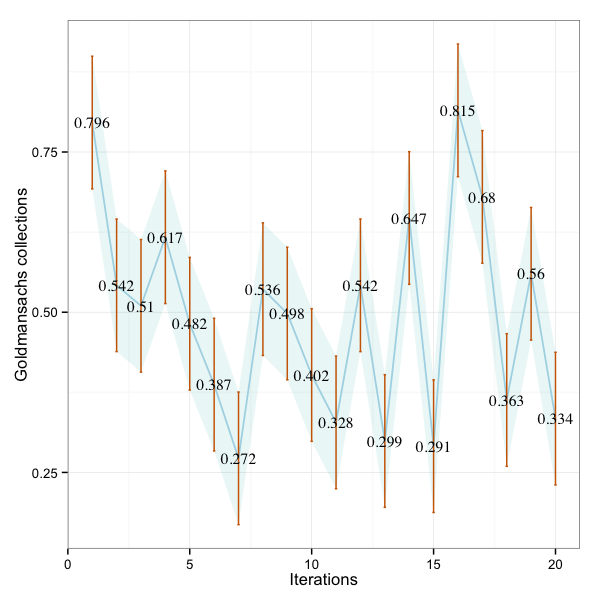
R graph showing error bars and 99% CI as a band
GS Collections
R summary
| Min. | 1st Qu. | Median | Mean | 3rd Qu. | Max. |
| 0.4860 | 0.5780 | 0.7970 | 0.4950 | 1.0060 | 1.4770 |
R graph showing error bars and 99% CI as a band